Introduction : Qborder is an Excel add-in designed to enhance data differentiation and visualization by automating the data sorting and border addition processes. The following installation and usage guide explains the steps to effectively use the Qborder add-in.
Caution : This program was developed and optimized for Microsoft Office 365, and works smoothly with Microsoft Office programs running the PC version of VBA.
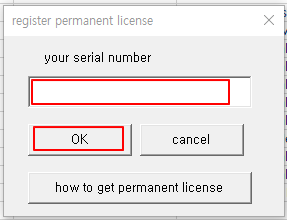
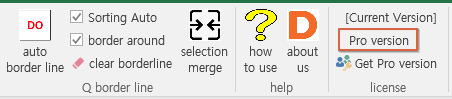
Demo (Free) Version Installation and (Paid) Pro Version Purchase:
Qborder is initially offered as a free demo version. Download the compressed zip file of the Demo (Free) version and change the file extension to “.exe” for installation.
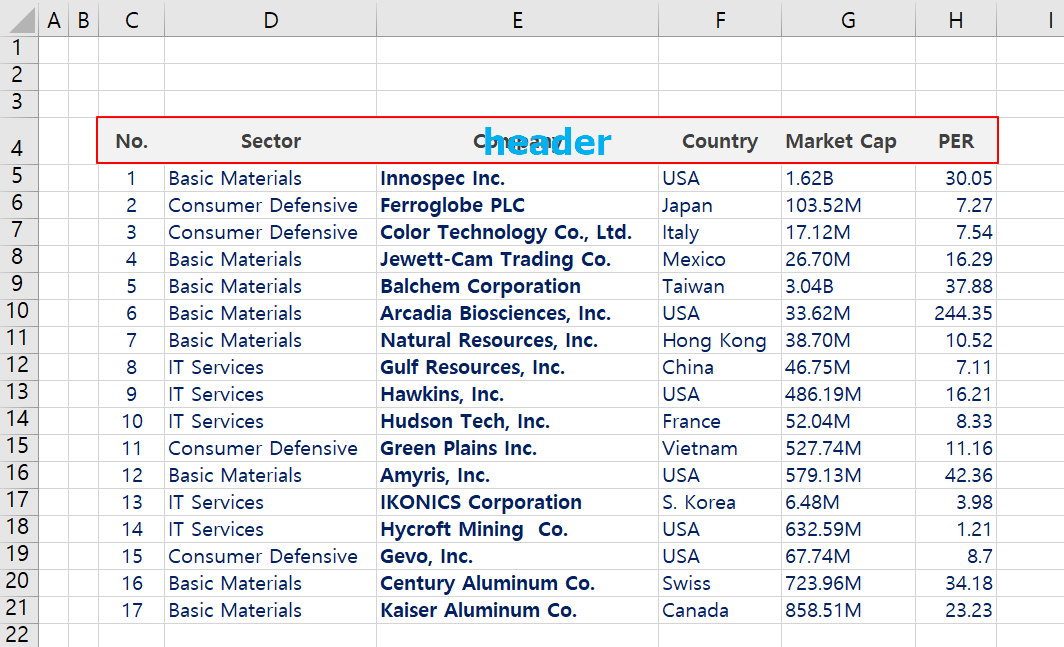
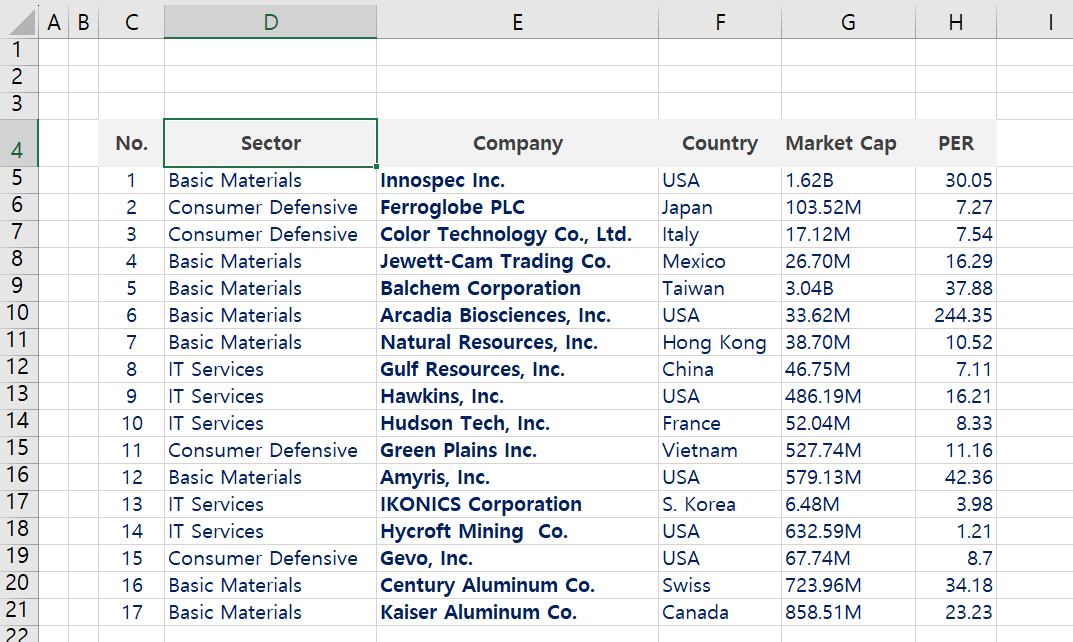
Open an Excel workbook containing the data you want to sort and make border lines.
Select the header that serves as the basis for data sorting.
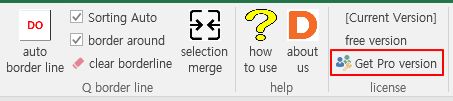
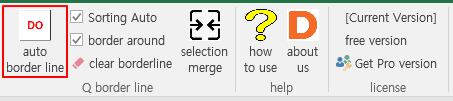
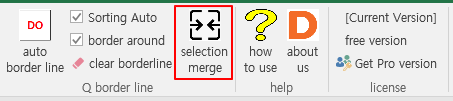
Go to the menu and press the “auto border line” button to process.
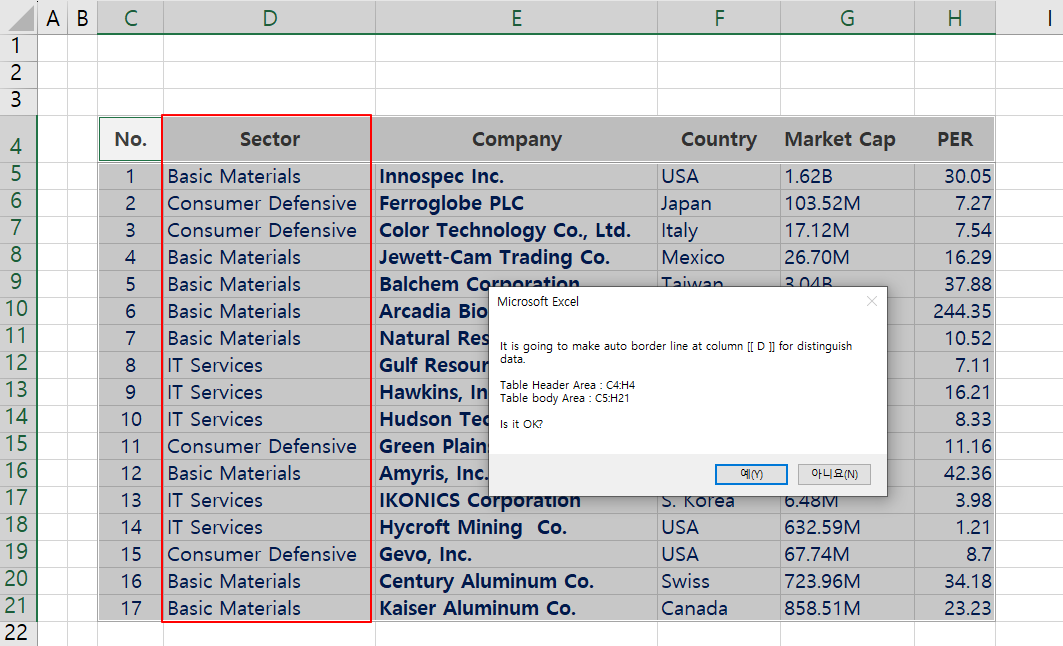
A message box will appear displaying information about the selected table header area and table body area. After confirming the information, click “Yes” to proceed.
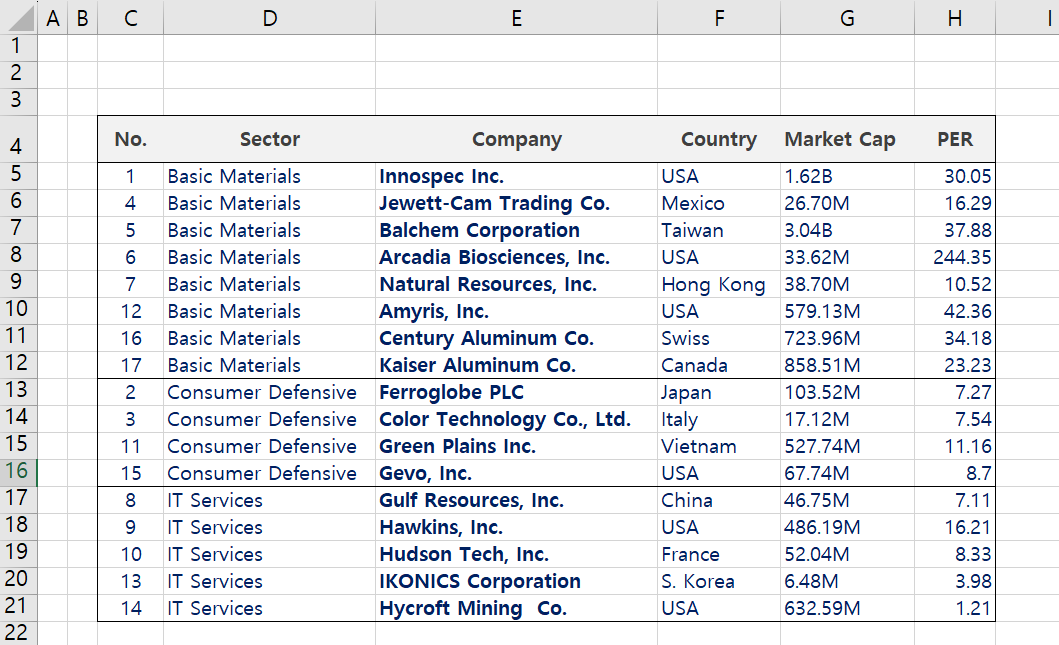
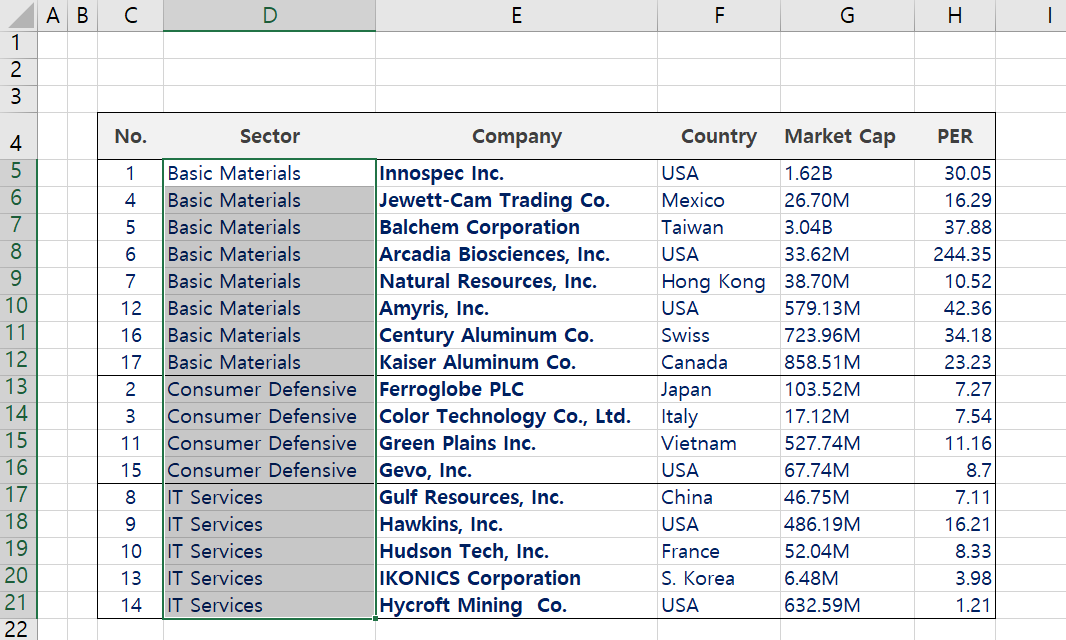
After running Qborder, the data is initially sorted in ascending order. and border lines will be added between different rows, and an outline is drawn around the table.
You can merge cells with the same values by clicking the “Selection Merge” button.
Select the specific range of cells that you want to merge.
Click the “Selection Merge” button.
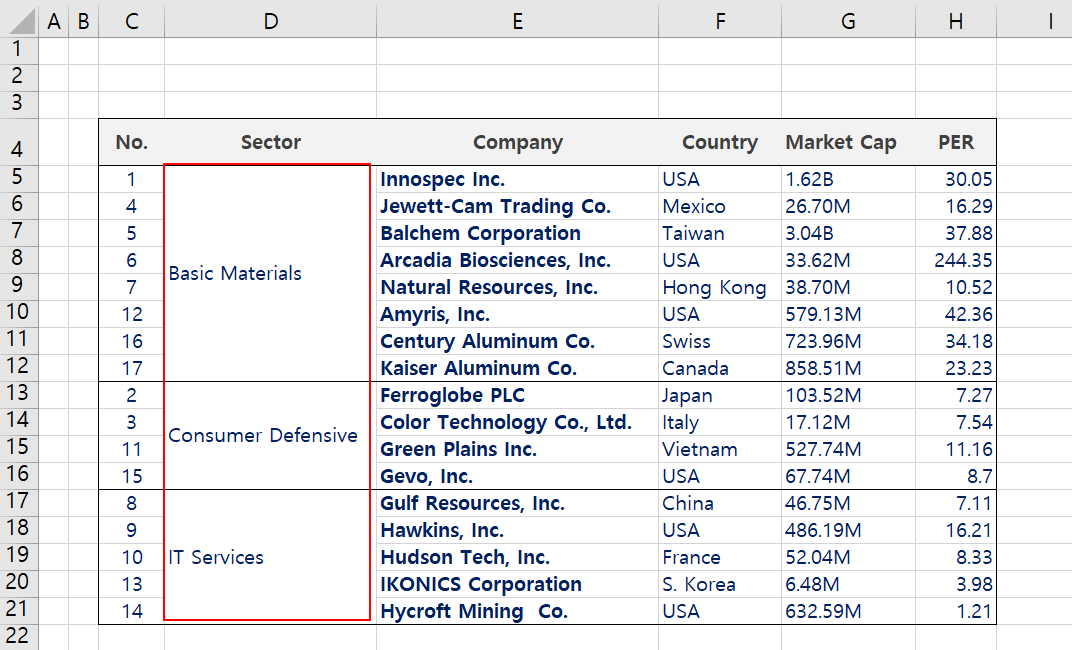
You will see the selected range with cells containing the same values merged together.
[This is a video of the program running.] Select the header you want to align (ex. Country) and press the “auto border line” button. If so, you can see the table automatically sorted based on the selected header and border lines are added. If you want to clear the dividing line, click ‘clear borderline’ button. If you want to sort by other column, select the header of the column(ex. industry). After that, if you press the “auto border line” button, you can see the table automatically sorted based on the selected header and border lines are added.

test.. good product